
Population analyst and MLC Paul Craine looks at the Isle of Man’s population imbalances, as highlighted by the 2021 Census, and attempts to show why these imbalances challenge the argument that the island’s population should ‘stay the same’ over the short to medium term.
He also explores what might be achieved – indeed, what must be achieved – if Tynwald decides to approve an economic strategy that could increase the island’s population by 1,000 per year over the next 15 years.
Zero Population Growth
The Isle of Man has reached zero population growth – and many people might welcome that.
 New organ donation law to come into force as island urged to ‘make informed choice’
 Department outlines new education priorities as Tynwald receives updated plan
.jpeg?width=209&height=140&crop=209:145,smart&quality=75) Tynwald rejects referendum on Isle of Man's Net Zero policy
Tynwald rejects referendum on Isle of Man's Net Zero policy Operating the Isle of Man’s Liverpool ferry terminal costs more than £710,000 a year
The population recorded by the 2021 census was still more than 400 lower than it was in 2011.
According to the latest Social Attitudes Survey in 2019: ‘The greatest proportion of respondents, and very nearly the majority (48%), feel that the island’s population should remain at its current level.’
This view had remained constant over the previous two years: the comparable figures in 2017 and 2018 were 49% and 48% respectively.
In 2016, however, before the publication of the 2016 Census, the picture was slightly different with 57% of the respondents suggesting that the population should remain at its current level.
These successive surveys, have also shown a growth in the support for population increase from 27% in 2016 to 39% in 2019.
Graph 1 shows the resident population of the Isle of Man since 2001.
The first 10 years of the century were characterised by population growth with the total number of residents rising from 76,315 to 84,497 between 2001 and 2011.
The population increased by an average of 750 per year up to 2006 and almost 890 per year in the following five years.
The 2016 Census showed a reversal into population decline as the number of residents dropped to 83,314; a modest fall of almost 240 per year.
The latest head count in the 2021 Census shows growth of just 150 per year to give the island a population of 84,069 in 2021.
Attitudes relating to the size of the island’s population are affected by a range of factors from political and economic, to environmental and social.
Arguments in favour of zero, or slow, population growth have been well rehearsed over many years and have stood the test of time.
They cover the impact of population growth on house prices, the dilution of Manx culture, the spread of settlements into the Manx countryside and pressure on infrastructure as well as growing inequality.
Arguments in favour of population growth have also been voiced repeatedly and often with numerous possible targets being offered, some well in excess of 100,000.
These have tended to focus on growing and diversifying the economy, attracting inward investment, meeting employment demand, funding growing pension costs, increasing the skills base and expanding the range of services on offer.
Population imbalances
The difficulty with zero population growth is that this does not equate to the population staying the same.
The island’s population total may have flatlined over the past 10 years but between 2011 and 2021 it has seen some significant changes that have resulted in very considerable imbalances.
Graph 2 shows the population structure of the Isle of Man in 2011.
This might be considered as broadly ‘balanced’.
The large cohort aged 60 to 64 years is the post-war ‘baby-boom’ group, which reflected a higher level of births in the years immediately after the Second World War.
Leaving that group aside, this developed profile has relatively straight sides, though with the largest groups between 40 and 54 years reflecting inward migration of younger working adults in the late 1980s and 1990s.
The distribution across the four broad age groups shown in yellow (over 65 years), light orange (40-64), dark orange (15-39) and red (under 15) approximately equal 15,000, 30,500, 25,000 and 14,000 respectively.
Graph 3 shows the size of the island’s population was just over 400 lower than in 2011 – but this profile shows a very different population structure.
The distribution across the four broad age groups now equals 18,500, 30,000, 23,000 and 12,500 respectively.
The population has noticeably aged, as has the distribution of the working population within the 15-64 groups.
The yellow (over 65 years) group has increased by more than 3,500 (24%) since 2011.
In the most recent census the Isle of Man recorded 22.1% of the population over the age of 65 years making it one of the six oldest countries in the world.
Taken together, the two orange (15-39 and 40-64 years) age groups have fallen by almost 2,500 over the same period, with the darker orange 15-39 years group declining by almost 9%.
The red (0-14 years) age groups in the second profile show a remarkable narrowing of the base.
Between 2011 and 2021, the number of young people aged under 15 fell by more than 1,500 (a fall of almost 11%).
In 2011 there were over 4,600 children under the age of 5 years but by 2021 there were fewer than 3,500 (a 25% decline).
The population size of the Isle of Man has largely ‘stayed the same’ over the past 10 years – but the 2021 population has a very different composition with some strong imbalances.
Imbalance 1: Age
Whether measured by the percentage of the population aged over 65 or by the rising median age (up from 42.5 years in 2011 to 46.4 in 2021), the age structure of the island’s population is both imbalanced and extreme.
With the largest groups aged 50-64, the numbers aged over 65 can only grow over the next 15 years.
The difference in size between the 30,000 people in the 40-64 broad age group (light orange) and the 23,000 people in the 15-44 age group (dark orange) is very prominent.
We can look at this population ageing from the perspective of the island’s working population and question how the economy will be able to afford future pensions.
But perhaps the biggest difficulty faced by a community that has a high percentage of older people is that there is a shortage of working people to provide the level and range of social and health care services that are required. Age imbalance is not beneficial to any age group.
Imbalance 2: Migration of young adults
The 2021 census shows that in the 20-29 years age group emigration is much stronger than immigration – and the migration imbalance means that the island is losing its young adults.
This is not the result of students going to university as they are all counted as still resident on the island.
The significance of emigration in this age group is enormous.
Between 2011 and 2021 the number of women of child-bearing age (usually taken as 15 to 44 years) fell by 11.2%.
This is one of the prime reasons for the falling number of births.
There are other factors too – the tendency for women to have their first child at an older age, bigger gaps between children and fewer children.
These are wider trends developing far beyond the Isle of Man as global birth rates begin to fall.
Imbalance 3: Births and deaths
Births in the Isle of Man peaked in 2009 and 2010 when more than 1,000 births were recorded each year.
After 2010 there were 10 extraordinary, consecutive years of decline reducing the number of births to 660 in 2020 (a remarkable 35% reduction in 10 years).
Births had exceeded deaths in every year since 2001 giving natural population growth but by 2015 births had fallen below deaths and in 2020 and 2021 the gap between births and deaths had widened to over 200.
We are experiencing natural population decline resulting in fewer children.
The base of the 2021 profile above shows just 1,700 girls aged under five years.
Groups this size will further reduce the number of women of childbearing age in 20 years’ time.
The low level of births will not just remain visible in the island’s profile for many decades, it has the potential to become cumulative: fewer births today will contribute to fewer births in the following generation.
Given the island’s population imbalances, and the direction of travel, the need for intervention to ensure that the population of the island is sustainable is apparent.
A Population Rebalancing Select Committee has been established by Tynwald to recognise both the island’s demographic challenges and the long-term implications of population imbalance and to come up with workable solutions and recommendations before the end of the year.
Quite separately, one of the ‘policy pillars’ within the economic strategy prepared by KMPG also focuses on population and proposes efforts to grow the island’s population to 100,000 by 2037.
Tynwald is scheduled to debate these economic and population proposals in November this year.
The challenges of launching a successful population policy should not be underestimated.
The island is far from unique in having an ageing population, outmigration of young adults and declining births and the solutions will necessarily cover a wide area of social and economic development.
Population rebalancing… and growth
It might be possible to grow the population of the Isle of Man without rebalancing the island’s demographics.
A drive to encourage retirement immigration, for example, might do just that.
This might provide a boost to the economy in some of the ways outlined in Part 1 but it could make a negative contribution to the aim in the Island Plan to ‘build great communities’.
It is so important here that the economy serves the population, not that the population serves the economy.
At the same time, the scale of the population imbalances affecting the island’s communities are such that they cannot be mitigated without greater retention of our own young people and an influx of working adults under the age of 50 years.
If Tynwald commits to population growth, it is vital that this growth both influences migration, to reduce the age imbalance and stem the net loss of 20- to 29-year-olds, and also reverses the decline in the number of births.
Graph 4 is neither a forecast nor an estimate. There are no data trends or algorithms that can be used here as the movement from the flatlining of recent years into population growth actually requires a shift away from recent trends.
The profile is perhaps more conjecture than a projection as it has been prepared to offer an idea of what a population of almost 100,000 might look like – indeed, what it needs to look like to create a sustainable population going forward.
It will provide a starting point for debate and actions. I have prepared the profile for the census year of 2036, rather than the target year of 2037, and I have worked on the basis of a population of several hundred lower than the 100,000 target to allow for growth in the final year.
Constructing what the 2036 profile might look like has involved taking several factors into account including the starting (2021) population, the level and age-profile of migration to and from the island between 2016 and 2021 and the levels of mortality for different age groups (using comparable UK data).
The dominant factor, however, has inevitably been the need to portray an outcome of a more balanced population approaching 100,000 in size.
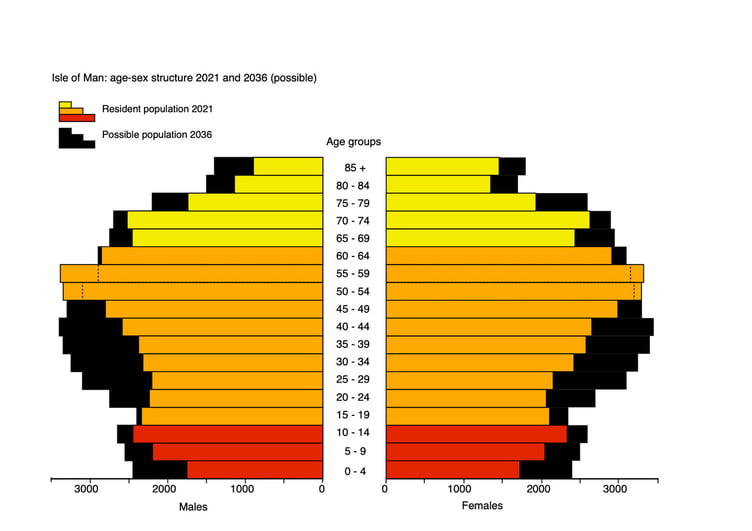
Graph 5 allows a comparison between the 2021 and possible 2036 profiles and shows what would need to be achieved to reach a population approaching 100,000 in 15 years.
The base of the 2036 profile allows that births would need to increase to 900 per year and net migration gains of over 200 per year in the 0-14 age group have to be achieved.
In the younger working age groups there is recognition that greater retention of young adults in the 15-29 age group is needed.
Between 2016 and 2021 almost a third of immigrants to the island were aged between 30 and 44 years and the profile has an expectation that this age group will continue to lead with net migration gains of around 400 per year.
In the 45-59 age group there is an assumption that net migration gains slow to around 300 per year partially offset by higher mortality perhaps producing 500 deaths in this age group over a 15-year period.
The profile recognises that the large 50-64 years age groups of 2021 will move up the profile and be replaced by small cohorts.
Above the age of 60 there is an expectation that net immigration will continue to slow down whilst mortality rises sharply with age.
The population aged over 65 years will grow in number but only by a small percentage.
The figure of 100,000 is not any sort of optimum for the Isle of Man and for most of the 40-plus years that I have been studying the island’s population I would have been very concerned by such a target.
But the population is showing extreme vulnerabilities due to ageing, net emigration of young adults and declines in both the number of women of child-bearing age and the number of births.
These vulnerabilities present a significant challenge that will not be resolved by intervention in a single area or by small scale initiatives.
A policy of steady growth at around 1,000 per year (only slightly higher than the growth of nearly 900 per year between 2006 and 2011) might be an appropriate part of such a policy.
It would also appear to be achievable if a range of barriers such as housing costs and child care costs can be reduced or removed.
Comments
This article has no comments yet. Be the first to leave a comment.