
Data from the government’s latest Isle of Man in Numbers publication suggests a sharp drop in house transactions from March last year.
But the drop may not be quite as steep as it seems.
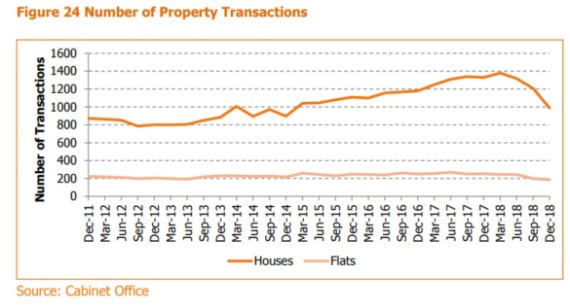
During the 12 months to December 2018, there were 989 house transactions lodged with the Land Registry, and 185 flat transactions, according to the report.
The average house price in the Isle of Man stood at £271,411 and the average flat price was £151,967.


.jpeg?width=209&height=140&crop=209:145,smart&quality=75)
.jpeg?width=209&height=140&crop=209:145,smart&quality=75)
While house prices and flat transactions have remained broadly constant over the last four years, a graph included with Isle of Man in Numbers suggests house transactions have fallen over 2018 from a high of nearly 1,200 in March last year and are now back to levels last seen in 2015.
The data is calculated on the basis of a 12-month rolling average to the end of each quarter and they are subject to revision as additional information is received by the Land Registry for a significant period of time afterwards.
Figures from the government’s latest quarterly economic report have revised numbers upwards but they still show a drop from a high in March.
Transactions in the first quarter are shown at 1,379, then 1,318 in the second quarter and 1,208 by September.
The average house price at the end of 2017, 2016 and 2015 was £269,000.
Comments
This article has no comments yet. Be the first to leave a comment.